 There is no shortage of arguments for why marketers should think long and hard about foregoing a content development budget in 2017. In fact, there have been numerous stats supporting this argument for a few years now and we’ve even talked quite a bit about his topic here, here and here. However, visual content seems to be the one budget area that draws the short straw every year during budget allocations.
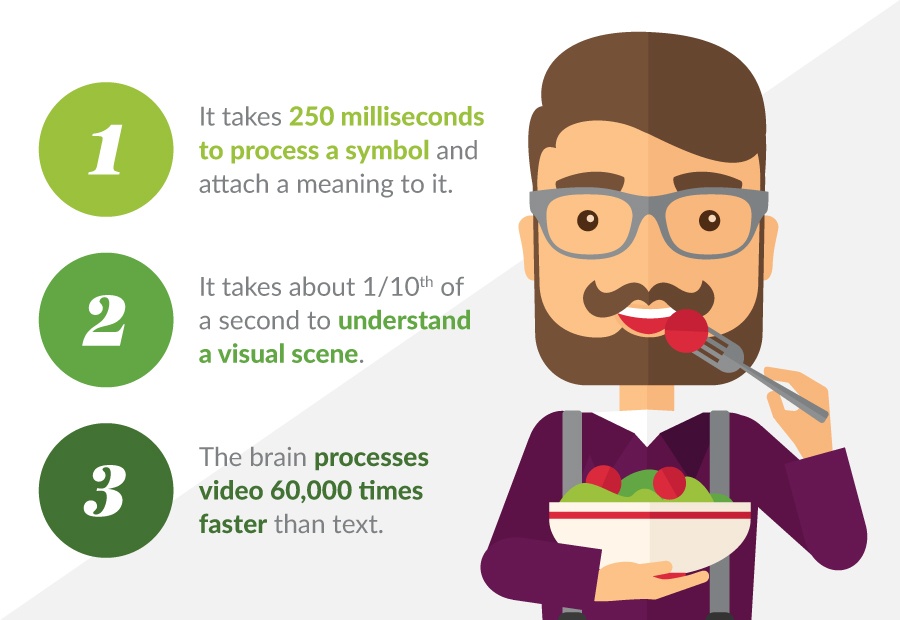
A recent HubSpot infographic shared some incredible data about content consumption based on how the brain processes information. If you still aren’t sure how important graphic and video content are to the health and wellness of your marketing efforts in 2017, these three stats alone should create some clarity for you:
- It takes 250 milliseconds to process a symbol and attach a meaning to it
- It takes about 1/10th of a second to understand a visual scene
- The brain processes video 60,000 times faster than text

To see how else visual content is the key to delivering memorable and persuasive content, check out the full infographic here.


