 As fresh produce marketers, we have so much data available to us through various analytical resources such as Google Analytics, Facebook Insights, Hootsuite, Pinterest and our favorite, HubSpot. Using these tools allows us to measure more and guess less! Properly measuring your marketing and critically thinking about how the data relates can lead us to better quantify and qualify our efforts to understand the stories that lie within our analytics.
When it comes to websites, many of us are successful at measuring our traffic and referral sources on a monthly basis, but are you paying attention to all the insights that are offered? Data on bounce rate and operating system sources are available to us through Google Analytics, but not all marketers understand why these are important to measure. Here’s why!
Operating System Sources
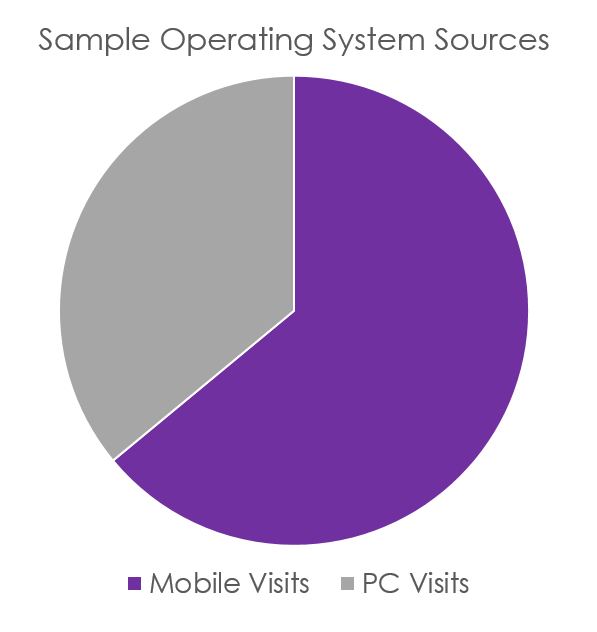
 You might wonder why it really matters what type of operating system your visitors are coming from and up until recently, it might not have made much of a difference. But with the rising use of mobile devices, many companies have seen the percentage of mobile users visiting their site skyrocket over the last couple of years. In fact, it’s not uncommon for nearly half of a company’s web visitors to come from a smart phone or tablet.
How can you tell? In your analytics tool, you will find a section dedicated to technology sources and that covers things like browsers and operating systems. You will want to note the traffic coming from iOS, Blackberry and Android in particular. Calculate those numbers as a percent of your total visits to know what portion of your visitors are using a mobile device to access your website or blog.
It’s increasingly important to invest in a mobile friendly site design that efficiently morphs to fit smart phone screens or even a mobile responsive site that automatically configures itself to best fit the device that it is being viewed on. The last thing you want to do is discourage visitors by delivering an unpleasant user experience.
Bounce Rate
Your website bounce rate tells you the rate at which a visitor exits your site from the page he came in on. The goal is to have visitors hit your website and peruse around (albeit efficiently) and absorb the content you have to share. A high bounce rate tells us that someone landed on your site and either didn’t find the information they were looking for, or they didn’t find information that was interesting enough to warrant their stay.
It is very common to see bounce rates spike during a promotional period when traffic is being drawn in with the promise of a prize – visitors enter to win the free thing and head on down the road.
Outside of promotional periods a bounce rate should maintain a fairly steady rate and hopefully trend down as you fine-tune the content you are discovering is the most interesting to your visitors. Tip: We like to see bounce rates BELOW 42%!
The key to implementing analytics-based marketing is to tackle the data in manageable buckets. We hope that our insights into these two often-missed numbers will help you in your 2016 analytics journey! If you’d like more insights into how you can use analytics to make impactful changes to your marketing strategy, download this guide.
